A heads-up with Professor Arcand for students of statistical methods
By Pulkit Bajpai and Rainer Mensing
Empirical results inform both academics and policy makers, and hence influence our lives as citizens. As students, we are taught that any kind of data analysis requires care and rigor in order to avoid bias and to make our findings transparent. One central concept used specifically for the interpretation of quantitative data is “statistical significance”[1].
Anyone who has ever come across a regression table has seen “statistical significance” applied, and so will many of you, at least the ones who are taking a statistics course at the Institute. A coefficient with a little star (or multiple) next to it, and in the footnotes: p < 0.05. Upon completion of the course, you will understand the message: star(s) = significant, no star(s) = not significant. A valuable rule of thumb? This seemingly magical formula has attracted a lot of criticism, and a recent special issue of the Journal American Statistician published in March was titled “Statistical Inference in the 21st Century: A World Beyond p < 0.05”. Its main message – “Stop using the term ‘statistically significant’ entirely”.
“I’ve always forbidden my students to put little stars”, says Professor Jean-Louis Arcand, head of the Department of International Economics, whom we interviewed in May to discuss this issue. “The basic critique, which I think that no one who uses statistics, economics, or any other discipline could disagree with, is about having these magical cut-off values.”
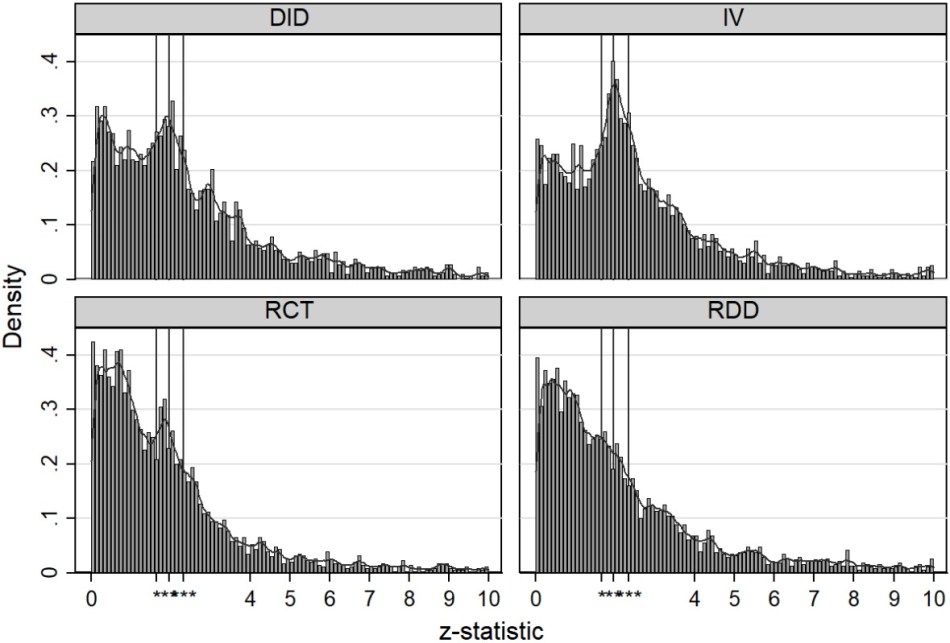
The critique of the common alpha values (0.1, 0.05, 0.01) is not only grounded in theoretical debates among statisticians, but also has to do with the political consequences of “significance” being associated with a concrete number. It perpetuates a perverse dynamic in quantitative sciences, not only economics. “P-Hacking” is the term used for manipulating your analysis until a significant effect on the coefficient in question appears. “When you look at the distribution of p-values in leading economics journals, the distribution is strangely centered and highly concentrated at 0.05.“ notes Professor Arcand, referring to a recent study that looked at 13,440 hypothesis tests in the 25 leading economics journals in 2015, the results of which you see in the title image.
An important characteristic of these statistics is that they don’t display the full distortion. Many studies that fail to produce “significant” coefficients, albeit this being an equally important finding, struggle to be published. “Unfortunately, the norms of the profession require you to have something which has a small p-value to get it published. This leads to a publication bias,” so Professor Arcand. Such practices arguably expose many economics papers to criticisms related to what the philosopher Karl Popper called “pseudo-science”. According to Popper’s definition, true “science” tries to prove a hypothesis by gathering possible evidence against it, while “pseudo-scientists” will bend any data-point in favor of their own theory.
A second important thing to understand is that the alpha values are entirely subjective. The significance of a 10 percent, 5 percent, or 1 percent chance of interpreting something wrongly should always depend on the context of each individual study. Professor Arcand provides a very personal example to illustrate this, “When I was slightly older than you guys, not much, my mother was diagnosed with uterine cancer. As an economist, I looked up the literature and told my mother that given the current literature, if she had a radical hysterectomy, the probability of her surviving was 97 percent. If this was the result of a test on her chance of dying, we would think that this is very insignificant, right? The chance of a ‘false negative’ is low. But the life of my mother was on the line in this case. She died. Thus, given the risks and given the cost, one and the same p-values might be interpreted very differently.”
Why do these magical-cuts off values, – which, according to a common legend were developed to improve the quality of Guinness – persist today? The answer to this question is not simple, but the need for simplification is certainly one reason why the concept is still taught in classrooms. “A quick recipe is easier for the teacher and the students, especially when we teach our MINT students” says Arcand. But are these quick recipes worth the cost of simplification? Professor Arcand himself views the role of his own department critically: “At the Institute, this is something which is really, really, really, important, and we’ve probably failed.”
But how then, should we interpret statistical results? The answer, if we like it or not, moves the interpretation of statistical data back to its due level of complexity. According to Professor Arcand, we should stick to the original form, the confidence interval, as a basis for interpretation. “That’s something which brings home the fact that the p-value is not this magical number and that there’s uncertainty in terms of our results. We know that there’s uncertainty and we should embrace that uncertainty.”
Eventually, the key thing to take away is that p-values are continuous variables and that, both technically and politically speaking, the dichotomy between “significant” and “insignificant” is misleading. Or as Professor Arcand puts it: Don’t put little stars!
Authors: Pulkit Bajpai (Masters in International Economics) & Rainer Mensing (Masters in Development Studies)
A link to the summary transcript of the full interview with Professor Arcand can be found here.
[1] “Statistical significance” in based on the p-value. A quick reminder: Consider I randomly test 20 people from the MINT compulsory stats class after the winter break to see if they remember what the p-value is (getting 1-YES, or 0-NO, as a result). If I take the average of all results and run a test, then the p-value indicates the likelihood of any result I might get, if I assumed in the beginning that nobody remembers anything (which would yield the result 0). If a “significant” amount of people pass the test, I would get a p-value of 0.05, or 5 percent, which tells me that there is only a 5 percent chance that in reality nobody remembers, given that people could get it right by chance.
Feature image caption: The four graphs represent different statistical identification methods. DID = Difference-in-Difference, IV = Instrumental Variable, RCT = Randomized Controlled Trial, RDD = Regression Discontinuity Design. The suspicious spikes in the distributions around the ‘little stars’ is evidence for so-called ‘P-hacking’. Source Brodeur, Cook & Heyes (2018, p. 15);

0 comments on ““Stop using the term statistically significant entirely.””